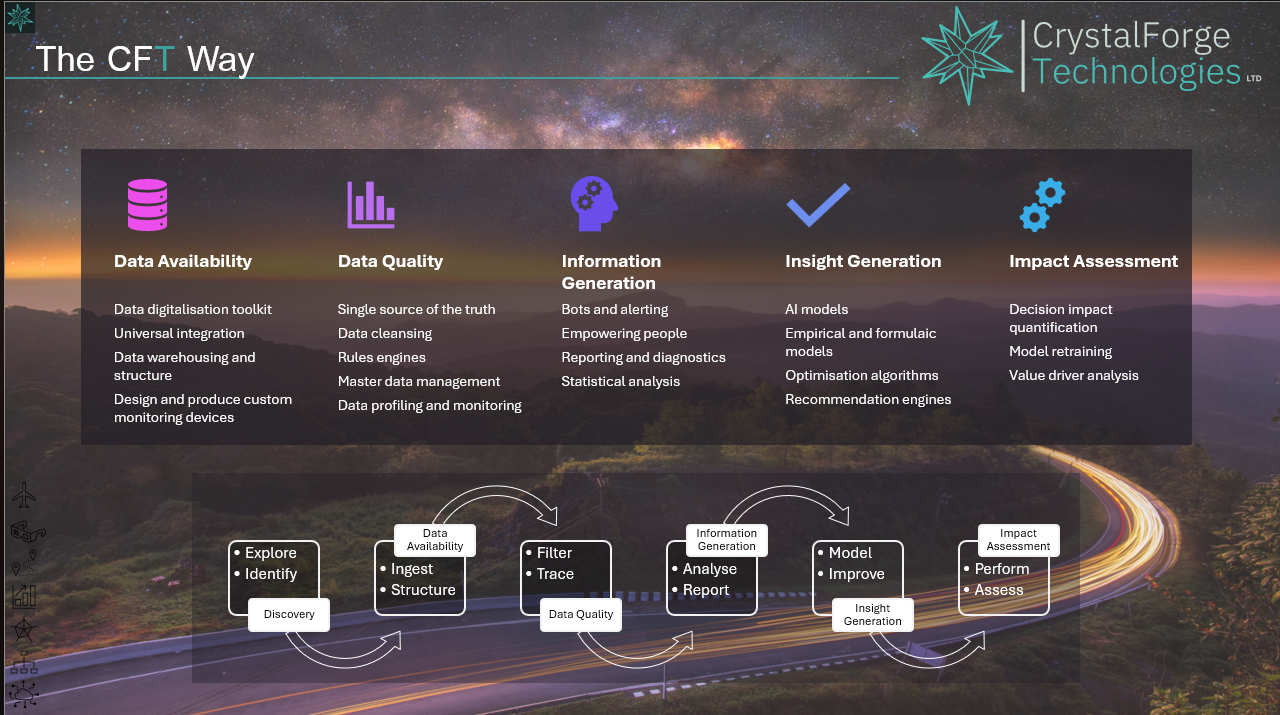
CFT Way Stage 3: Information Generation - From Data to Actionable Intelligence
Transform clean, reliable data into meaningful business intelligence through advanced analytics, reporting, and automated insights.
CFT Way Stage 3: Information Generation - From Data to Actionable Intelligence
With data availability and quality established, Stage 3 of the CFT Way focuses on transforming clean, reliable data into meaningful business intelligence. This stage bridges the gap between raw data and actionable insights, empowering teams with the information they need to make informed decisions.
The Information Challenge
Many organizations have good data but struggle to turn it into actionable information:
- Data rich, insight poor: Lots of data but limited understanding
- Analysis bottlenecks: Dependence on technical teams for basic insights
- Reactive decision-making: Discovering problems after they've occurred
- Information silos: Different teams working with different versions of truth
Our Information Generation Framework
1. Bots and Alerting Systems
Automated monitoring and notification systems that keep teams informed:
- Intelligent alerting: Context-aware notifications that reduce noise
- Threshold monitoring: Automated detection of operational anomalies
- Escalation workflows: Ensuring critical issues reach the right people
- Performance bots: Automated reporting on key business metrics
2. Empowering People
Building organizational capability to leverage data effectively:
- Self-service analytics: Tools that enable business users to explore data
- Data literacy training: Building analytical skills across the organization
- Collaborative platforms: Shared spaces for data exploration and insight sharing
- Citizen data scientist programs: Enabling domain experts to perform advanced analytics
3. Reporting and Dashboards
Visual insights tailored to different stakeholder needs:
- Executive dashboards: High-level KPIs with drill-down capabilities
- Operational reports: Real-time monitoring of business processes
- Analytical workbenches: Advanced tools for data exploration
- Mobile-first design: Access to insights anywhere, anytime
4. Advanced Analytics
Sophisticated analysis techniques that reveal hidden patterns:
- Statistical modeling: Understanding relationships and trends in data
- Pattern recognition: Identifying anomalies and opportunities
- Segmentation analysis: Understanding different customer or operational groups
- Correlation analysis: Discovering relationships between variables
5. Real-time Insights
Streaming analytics for immediate decision support:
- Live data processing: Real-time analysis of streaming data
- Event-driven analytics: Triggered analysis based on specific conditions
- Continuous monitoring: Always-on surveillance of critical metrics
- Instant notifications: Immediate alerts for time-sensitive situations
Implementation Roadmap
Phase 1: Foundation Setup (Weeks 1-3)
- Analytics platform deployment: Setting up core infrastructure
- Data connection establishment: Linking to Stage 2 quality data sources
- User access provisioning: Setting up security and access controls
- Initial dashboard creation: Building first set of key reports
Phase 2: Core Analytics Development (Weeks 4-8)
- Business intelligence development: Creating comprehensive reporting suite
- Self-service tool deployment: Enabling business user analytics
- Alerting system implementation: Setting up automated monitoring
- Training program launch: Building organizational analytics capabilities
Phase 3: Advanced Capabilities (Weeks 9-12)
- Advanced analytics implementation: Statistical modeling and pattern recognition
- Real-time processing setup: Streaming analytics capabilities
- Mobile platform deployment: Ensuring anywhere access to insights
- Performance optimization: Tuning systems for speed and efficiency
Phase 4: Adoption and Optimization (Weeks 13-16)
- User adoption programs: Driving organizational usage
- Feedback collection and iteration: Improving based on user needs
- Advanced training delivery: Building sophisticated analytics skills
- Success measurement: Tracking business impact and ROI
Information Architecture Design
Data Layer
- Curated data marts: Business-specific data collections
- Semantic layer: Business-friendly data definitions
- Metadata management: Documentation and data lineage
- Performance optimization: Fast query response times
Analytics Layer
- Calculation engine: Complex business logic processing
- Statistical processing: Advanced analytical computations
- Machine learning integration: Predictive and prescriptive analytics
- Real-time processing: Streaming data analysis
Presentation Layer
- Dashboard frameworks: Flexible visualization platforms
- Report generators: Automated report creation and distribution
- Mobile interfaces: Responsive design for all devices
- API endpoints: Integration with other business applications
User Experience Layer
- Role-based interfaces: Customized views for different user types
- Personalization: Individual preferences and customizations
- Collaboration tools: Sharing and discussion capabilities
- Search and discovery: Finding relevant insights quickly
Key Success Metrics
Adoption Metrics
- User engagement: 80%+ of target users actively using analytics
- Session frequency: Average 3+ analytics sessions per user per week
- Feature utilization: 70%+ of available features being used
- Self-service adoption: 60%+ of insights generated by business users
Performance Metrics
- Query response time: 95% of queries complete within 5 seconds
- System availability: 99.5%+ uptime for analytics platforms
- Data freshness: 95%+ of reports using data less than 1 hour old
- Alert accuracy: 90%+ of alerts result in meaningful action
Business Impact Metrics
- Decision speed: 50% reduction in time from question to insight
- Insight quality: 80%+ of insights lead to actionable decisions
- Problem detection: 70% of issues identified before they impact business
- ROI measurement: 300%+ return on analytics investment
Case Study: Retail Chain Information Generation
A national retail chain with 500+ stores struggled with fragmented reporting and slow decision-making:
Initial Challenges:
- 48-hour delay between events and insights
- 15 different reporting systems with inconsistent data
- 80% of management time spent gathering data vs. analyzing it
- Critical issues discovered days after they occurred
CFT Stage 3 Implementation:
- Unified analytics platform with real-time data processing
- Role-based dashboards for different management levels
- Automated alerting for inventory, sales, and operational issues
- Self-service analytics tools for store managers
Results After 6 Months:
- Real-time visibility into all 500+ store operations
- 85% reduction in time spent on data gathering
- 60% faster response to operational issues
- $3.2M annual savings from improved decision-making
- 92% user adoption rate across management team
Technology Stack Components
Analytics Platforms
- Business Intelligence tools: Comprehensive reporting and visualization
- Self-service analytics: User-friendly data exploration tools
- Statistical software: Advanced analytical capabilities
- Real-time processing: Streaming analytics platforms
Visualization Tools
- Dashboard builders: Drag-and-drop interface creation
- Chart libraries: Comprehensive visualization options
- Mapping tools: Geographic and spatial analysis
- Mobile frameworks: Responsive design capabilities
Alerting Systems
- Monitoring platforms: Comprehensive system surveillance
- Notification engines: Multi-channel alert delivery
- Workflow automation: Intelligent escalation and routing
- Integration APIs: Connection to business systems
Collaboration Platforms
- Shared workspaces: Team-based analytics environments
- Annotation tools: Commentary and discussion features
- Version control: Tracking changes and iterations
- Knowledge management: Capturing and sharing insights
Best Practices for Information Generation
1. Design for Your Users
- Understand different user types and their needs
- Create role-appropriate interfaces and information
- Prioritize ease of use over technical sophistication
- Provide training and support for adoption
2. Start with Business Questions
- Begin with the decisions that need to be made
- Work backwards from business outcomes to data requirements
- Focus on actionable insights, not just interesting information
- Measure success by business impact, not technical metrics
3. Build for Scale and Performance
- Design systems that can grow with your organization
- Optimize for fast query response times
- Plan for increasing data volumes and user loads
- Implement caching and performance tuning strategies
4. Ensure Information Quality
- Validate analytical results against known benchmarks
- Implement quality checks for calculated metrics
- Provide confidence indicators for insights
- Enable users to understand data lineage and methodology
5. Foster a Data-Driven Culture
- Celebrate insights that drive business value
- Share success stories across the organization
- Encourage experimentation and exploration
- Provide ongoing training and skill development
Moving to Stage 4: Decision Intelligence
With robust information generation capabilities in place, you're ready for Stage 4 of the CFT Way: Decision Intelligence. This stage focuses on building systems that not only provide insights but actively support and optimize decision-making through predictive analytics, scenario modeling, and prescriptive recommendations.
Ready to transform your data into actionable intelligence? Contact our team to learn how Stage 3 of the CFT Way can bridge the gap between data and decisions in your organization.
Tags
Related Insights
Continue exploring our data intelligence expertise